> For the complete documentation index, see [llms.txt](https://knowledgebase.autorabit.com/llms.txt). Markdown versions of documentation pages are available by appending `.md` to page URLs; this page is available as [Markdown](https://knowledgebase.autorabit.com/product-guides/integral-zone/iz-analyzer/source-code-analysis/code-analysis-in-studio.md).
# Code Analysis in Studio
{% hint style="warning" %}
Before analyzing the source code in Studio, make sure you have either
* Installed and configured IZ Analyzer - [Anypoint Studio Plugin](/product-guides/integral-zone/iz-suite/iz-scan/anypoint-studio/installation/install-iz-analyzer-studio.md).
* Installed and configured IZ Analyzer - [WSO2 Integration Studio Plugin](/product-guides/integral-zone/iz-suite/iz-scan/anypoint-studio/installation/install-iz-analyzer-studio.md).
{% endhint %}
### On The Fly Results
**`On The Fly Results`** table/view will display the issues related to the project that user is working on. Project is determined based on the current active file (i.e. the file that user is working on) in Anypoint Studio.
Issues will be detected and reported as and when the connectors are configured in the editor. With this, the issues can be fixed even before they exists.
Follow the below steps to explore **`On The Fly Results`** view.
1. Go to **`Window`** -> **`Show View`** -> **`other`** -> **`IZ Analyzer`** -> select **`On the Fly Results`**
2. Open any mule project xml, the issues will be automatically detected and the results can be seen in **`On the Fly Results`** panel.
* NOTE: **`On The Fly Results`** scans the whole project corresponding to current mule project xml and displays the results
### On The Fly Results Tab Features
The Results tab provides options such as start or stop analysis, sync rules from the server, reload on the fly results and helps us to quickly sort through the results based on file type, component type and severity.
1. Go to **`Window`** -> **`Show View`** -> **`other`** -> **`IZ Analyzer`** -> select **`On the Fly Results`**. The options are displayed at the top right corner.
2. By default the analysis is active and will immediately report any issues it sees fit. Clicking on the **`Stop Button`** will stop the analysis. You can start it at a later time once a part of your development is completed.
3. Your organization might have added new rules or updated the rules in server. By clicking on the **`Sync Rules`** option, you will be importing these updated rules onto Anypoint studio.
4. By Clicking on **`Reload on the fly results`** option, your project will be validated against the rules to refresh the tab so as to display any new issues along with the previously displayed issues.
5. The Issues seen in the On The Fly Results tab can be grouped based on file type, component type and severity.
1. Grouping based on **`File Type`**.
2. Grouping based on **`Component Type`**.
3. Grouping based on **`Severity`**.
### Issue Fix Recommendation
**`On The Fly Results`** precisely point out the problem in each file with line number, but many users might not be aware of issue fix.\
Issue fix recommendation helps to deal with this scenario with detailed description and examples on how to fix the issue.
1. Double click on any issue that need a fix to open up the **`Rule Description`** view.
2. **`Rule Description`** view provides information about:
* Type of Issue. E.g.: **`Code Smell`**, **`Bug`**
* Detailed description of the violated rule/issue
* Non Compliant Code Example
* Compliant Code Example, which guides developers on how to fix the issue
* Optionally, an external link to any official documentation for further information about the fix
### Upload to Server
After development is complete, users might want to upload the project to server and save the analysis results or for any other purposes.\
IZ Analyzer provides an easy option to upload project to server from Anypoint Studio.
{% hint style="info" %}
This step assumes that the server details are configured well in advance as mentioned in Installing Studio Plugin SonarQube version 9.x and above requires Java version 11 to scan the projects. It is recommended to use Anypoint Studio version greater than 7.9.0 to use this feature with latest versions of SonarQube.
{% endhint %}
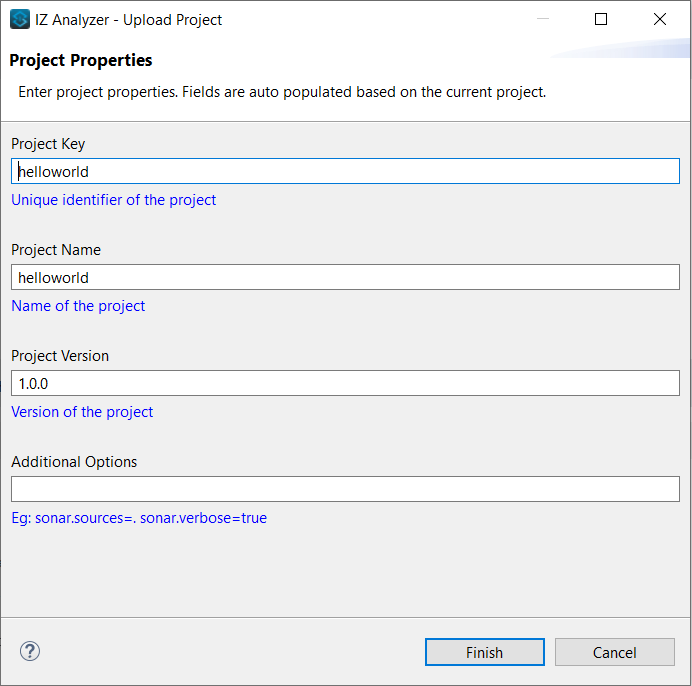
1. Right click on the project that needs to be uploaded to server, click on **`IZ Analyzer - Server Upload`**
2. Fill in the values required for server upload and click on **`Finish`**:
1. Project Key - Unique key of the project
2. Project Name - Display name of the project
3. Project version - Version of the project
3. Detailed logs of upload/scanner process will be displayed in **`console`** view\
4. Results of analysis can be further explored in Analyzer] dashboard
### See Also
* [Code Analysis In Server](/product-guides/integral-zone/iz-analyzer/manage-server-plugin/install-server-plugin.md)
---
# Agent Instructions
This documentation is published with GitBook. GitBook is the documentation platform designed so that both humans and AI agents can read, navigate, and reason over technical content effectively. Learn more at gitbook.com.
## Querying This Documentation
If you need additional information that is not directly available in this page, you can query the documentation by asking a question.
Perform an HTTP GET request on the following URL with the `ask` and `goal` query parameters:
```
GET https://knowledgebase.autorabit.com/product-guides/integral-zone/iz-analyzer/source-code-analysis/code-analysis-in-studio.md?ask=&goal=
```
`ask` is the immediate question: it should be specific, self-contained, and written in natural language.
`goal` is what the user is ultimately trying to achieve, the reason they need the answer. Sharing it helps GitBook give you a better, more relevant answer. A goal is most helpful when it describes the outcome the user wants rather than restating the question. For example, with `ask=how do I create an API token`, a goal like `automate deployments from our CI pipeline` lets GitBook tailor the answer to that use case.
The response will contain a direct answer to the question and relevant excerpts and sources from the documentation.
Use this mechanism when the answer is not explicitly present in the current page, you need clarification or additional context, or you want to retrieve related documentation sections.