> For the complete documentation index, see [llms.txt](https://knowledgebase.autorabit.com/llms.txt). Markdown versions of documentation pages are available by appending `.md` to page URLs; this page is available as [Markdown](https://knowledgebase.autorabit.com/product-guides/vault/vault-features/anomaly-detection.md).
# Anomaly Detection
## About This Guide
Anomaly Detection scans configured Salesforce data and metadata for activity that exceeds defined deviation thresholds. This guide follows the supplied application flow from initial setup through anomaly review, rollback, comparison, pausing, stopping, and resuming monitoring.
Interface examples use Salesforce org 100\_GB\_Org and the Account object. Displayed dates, record counts, labels, email addresses, and object fields reflect the captured application state.
### Status Reference
* Initialize - Vault prepares or restarts the Anomaly Detection job.
* Active - monitoring is enabled and scheduled activity is evaluated.
* Paused - monitoring is suspended until the selected date is cleared or reached.
* Stopped - monitoring is turned off until the permanent-stop control is disabled and resume is confirmed.
## Configure Anomaly Detection
The configuration flow selects the monitored Salesforce data and metadata, applies deviation thresholds, defines notification recipients, and excludes specified Salesforce activity from analysis.
### Open the configuration workflow
Open ANOMALY DETECTION > CONFIG and select a Salesforce org. When no configuration exists, the page displays the Anomaly Detection setup message. Select the Configuration Settings gear icon or Set Up Anomaly Detection Now to begin.
Empty configuration state with the Configuration Settings tooltip
### Select data objects and deviation thresholds
The Config Creation dialog opens on the DATA tab. Select each object that requires monitoring and enter a Percentage Deviation value from 1 through 100. The configured percentage defines the threshold used to flag unusual change activity.
Config Creation DATA tab with object and percentage-deviation controls
{% hint style="info" %}
**Note:** Anomaly Detection runs daily at 1:00 AM UTC. Configuration changes take effect during the next scheduled run. Daily changes are tracked and notification email is sent.
{% endhint %}
### Apply the data selections
Select the required object checkboxes and confirm the percentage-deviation values. Selected objects remain enabled for monitoring, while unselected objects remain outside the configuration.
Selected objects on the DATA tab
### Open the MetaData configuration
Select the MetaData tab. The list displays supported metadata types together with a Percentage Deviation value for each type.
MetaData tab with available metadata types
### Select metadata types
Select the metadata types that require anomaly monitoring and retain or update the percentage-deviation thresholds. The displayed configuration includes AIApplicationConfig and ActionLauncherItemDef as selected examples.
Selected metadata types and deviation thresholds
### Configure email recipients
Under Email Notifications, select Select Vault Users. The selected Vault accounts receive anomaly-detection notification email.
Select Vault Users link under Email Notifications
### Apply Vault notification recipients
User Details lists each Vault account by Name, Email, Role, and Status. Select the required active accounts and select APPLY to return the selections to Config Creation.
User Details dialog for Vault notification recipients
### Configure excluded Salesforce activity
Under Exclude Changes of Users, select Salesforce Users. Activity performed by the selected Salesforce accounts is excluded from anomaly evaluation.
Salesforce Users link under Exclude Changes of Users
### Apply excluded Salesforce users and save
The Salesforce User Details dialog lists Username, Email, and Profile Name. Select the Salesforce accounts whose changes must be excluded, select APPLY, then select SAVE CONFIGURATION in Config Creation.
Salesforce User Details dialog for excluded change activity
## Activate and Monitor Anomaly Detection
After the configuration is saved, Vault initializes the monitoring job and then displays daily data and metadata activity for the selected seven-day range.
### Review the initialization state
The status changes to Initialize while Vault prepares Anomaly Detection. Data and Metadata panels display No data available and No metadata available until monitored activity becomes available.
Initialize status while Anomaly Detection starts
### Confirm the active state
The status changes to Active when anomaly monitoring is enabled. The refresh icon updates the displayed status and dashboard information.
Active status on the Anomaly Detection dashboard
### Review deleted-record activity
Select an object in the Data panel and move the pointer over a chart bar to display the activity tooltip. The displayed example shows Delete: 6 for 4 Jul.
Data chart tooltip showing six deleted records on 4 Jul
### Review added-record activity
Move the pointer over another chart bar to review its date, change type, and record count. The displayed example shows Add: 10 for 6 Jul.
Data chart tooltip showing ten added records on 6 Jul
## Review Anomalies and Run a Rollback
Anomaly Details exposes affected records for a selected date and object. Individual records can be selected for rollback, while Compare evaluates the complete result set.
### Open Anomaly Details
Select a chart result to open Anomaly Details. Use Selected Change Type, Object List, Display Columns (Max 7), and Select Date to refine the record list. Select Export to export the displayed anomaly data.
Anomaly Details with deleted Account records
{% hint style="info" %}
**Note:** Compare evaluates all records. Rollback becomes available only after one or more specific records are selected.
{% endhint %}
### Select records for rollback
Select the required record checkboxes. The page reports the number selected and provides Click here to select all the 6 records when the complete result set is required. Select ROLLBACK to continue.
Selected anomaly record with the ROLLBACK action enabled
### Acknowledge rollback considerations
Vault displays rollback considerations before the RollBack Summary opens. Select GOT IT after reviewing the conditions that can affect rollback execution.
Rollback considerations displayed before job configuration
{% hint style="info" %}
**Important:** Rollback failures can result from active triggers, process builders, workflows, flows, validation rules, inactive Salesforce owners, or missing dependencies such as required fields. Salesforce limits uncompressed metadata to 500 MB per job; an appropriate batch size is required when metadata exceeds that limit.
{% endhint %}
### Complete the RollBack Summary
Review Org Name and Rollback Label, enter a Batch Size when required, and confirm the Email notification recipient. Enable the required execution controls, including Disable Workflows, Disable Validation rules, Disable Triggers, Disable Flows, unique-identifier duplicate prevention, blank-value override, Serial Mode for Bulk API, or restricted-delete handling. Select ROLLBACK.
RollBack Summary with execution controls and selected record count
{% hint style="info" %}
**Note:** The displayed Batch Size field supports a maximum value of 9999. The Data summary identifies the object, number of fields, and number of records included in the job.
{% endhint %}
### Confirm rollback initiation
Vault displays Rollback has been initiated successfully. Select OK to close the confirmation and continue to rollback monitoring.
Successful rollback-initiation confirmation
### Monitor an in-progress rollback
Open ANOMALY DETECTION > ROLLBACK and select the Salesforce org. Enable Show In Progress Jobs when required. The status indicator displays the In Progress tooltip while the rollback runs.
Anomaly Rollback page with the In Progress tooltip
### Review the completed rollback row
After completion, the row displays Duration, Total Count, Success Count, Failed Count, and a completed status indicator. Moving the pointer over the label displays the complete rollback label.
Completed rollback with the full-label tooltip
### Review the data rollback log
Open the rollback log and select the DATA tab. Failure Records and Success Records switches control the displayed results. The object row reports Success and Failures and provides a Download action for the result file.
DATA rollback log with success, failure, and download information
### Review the metadata rollback log
Select the METADATA tab to review Failure Members and Success Members. The displayed example reports No data. Select EXPORT when metadata-member results are available.
METADATA rollback log with no member results
### Use the View Log action
Move the pointer over the document icon in the Action column to display the View Log tooltip. Select the icon to reopen the detailed DATA and METADATA rollback log.
View Log tooltip in the rollback Action column
## Compare Anomaly Records and Review Results
A comparison evaluates the selected object's anomaly snapshots, highlights changed values, supports record-level inspection and export, and permits re-execution with a revised field set.
### Return to the monitored activity
Return to CONFIG and select the monitored object. The Active dashboard continues to show Add, Delete, and Modify activity. The displayed chart tooltip identifies Delete: 6 for 4 Jul.
Active dashboard with a deleted-record activity tooltip
### Start a comparison from Anomaly Details
Open the applicable Anomaly Details view and select COMPARE. Comparison evaluates every record in the current anomaly result, so record selection is not required.
COMPARE action on Anomaly Details
### Confirm comparison initiation
Vault displays that the comparison is initiated successfully and that notification email is sent after completion. Select OK to close the confirmation.
Successful comparison-initiation confirmation
### Monitor the comparison job
Open ANOMALY DETECTION > JOB HISTORY, select Source Org, and select APPLY. The comparison row displays SnapShot1, SnapShot2, Object, Fields, Last Run Date, Valid Until, Compared By, Duration, Total Compared Records, Status, and Actions.
Comparison row in Anomaly Detection Job History
### Display the complete comparison label
Move the pointer over the truncated Compare Label to display the complete label in a tooltip. The displayed example is Anomaly\_Mon, 06-Jul-26 04:14 PM GMT.
Complete comparison label displayed in a tooltip
### Review Anomaly Detection Results
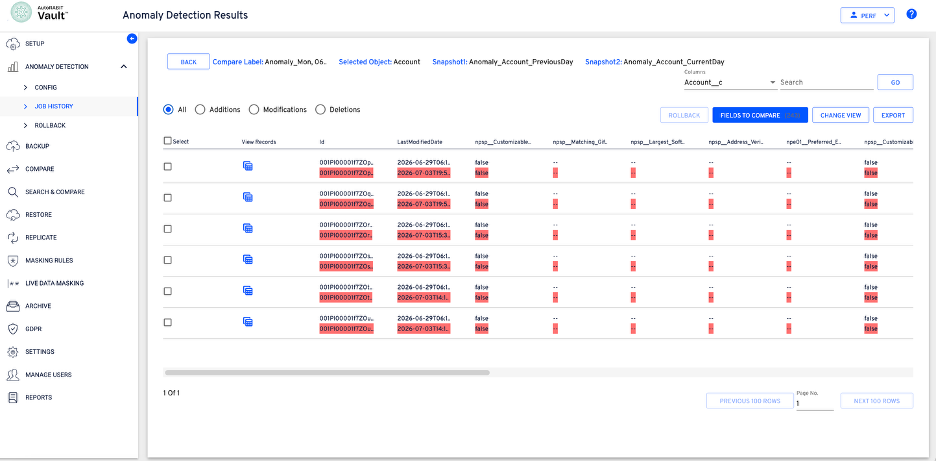
Open the comparison result from Job History. The results page identifies Compare Label, Selected Object, Snapshot1, and Snapshot2. Use All, Additions, Modifications, or Deletions to filter the records. Changed snapshot values are highlighted in red.
Anomaly Detection Results with snapshot differences
### Open a record comparison
Move the pointer over the record-detail icon to display the viewrecords tooltip. Select the icon to compare the field values for the corresponding record.
ViewRecords tooltip for record-level comparison
### Compare field values for one record
The View Record dialog lists each Field with its Snapshot-1 and Snapshot-2 values. Review the required values, scroll for additional fields, and select Close when the review is complete.
View Record dialog comparing Snapshot-1 and Snapshot-2
### Open the export workflow
Select EXPORT to download comparison results. The exported scope is selected in the Export dialog.
EXPORT action on Anomaly Detection Results
### Choose the export scope
In the Export dialog, select All Records, Records Displayed On The Current Page, or Selected Records. Select OK to generate the export, or select CANCEL to return without exporting.
Export dialog with available record scopes
### Change the displayed result columns
Select CHANGE VIEW to revise the fields displayed as columns in the results grid.
CHANGE VIEW action on Anomaly Detection Results
### Select fields for the result view
The Fields dialog displays the selected count and a searchable field list. Select or clear fields and select OK to apply the display changes. A maximum of 20 columns can be selected at once.
Fields dialog for result-column selection
### Select compared records for rollback
Select the required result rows or select the header checkbox. The page reports the number selected and enables ROLLBACK. Select Click here to select all the 6 records when the complete set is required.
Selected comparison-result rows with ROLLBACK enabled
### Revise the fields used for comparison
Select FIELDS TO COMPARE. The number in parentheses reports the fields currently included in the comparison; the displayed example contains 243 fields.
FIELDS TO COMPARE action with the current field count
### Select comparison fields and re-execute
The Select Fields Of : Account dialog lists the available Field API Name values. Select or clear the required fields, then select COMPARE to re-execute the comparison with the revised field set.
Field API selections for comparison re-execution
### Confirm comparison re-execution
Vault confirms that re-execution of compare records started successfully and that status is updated shortly. Select OK to return to the results workflow.
Successful comparison re-execution confirmation
### Review the completed re-execution
Return to Job History and refresh the page. The completed row shows the updated Last Run Date, Valid Until, Duration, and Total Compared Records values.
Completed re-executed comparison in Job History
### Identify the compared object
Move the pointer over the Object value to display its full tooltip. The displayed tooltip identifies Account.
Account tooltip in the Object column
### Review comparison-field status from the object
Select the linked object value to open the comparison-field status dialog. The dialog identifies the Compare Label and Object and lists Field API Name values with green status indicators.
Comparison-field status dialog opened from the object link
### Locate the View Fields action
Move the pointer over the Fields icon to display the View Fields tooltip.
View Fields tooltip in Anomaly Detection Job History
### Review comparison-field status from View Fields
Select the View Fields icon to open the same comparison-field status dialog. Scroll through the Field API Name list to review the status of every compared field.
Comparison-field status dialog opened from View Fields
## Pause, Stop, and Resume Anomaly Detection
The CONFIG dashboard provides temporary and permanent lifecycle controls. A pause suspends monitoring until a specified date, while the permanent control stops the job until it is explicitly resumed.
### Select a temporary pause date
Select the calendar under Pause anomaly detection until and choose the date through which monitoring remains paused.
Pause-date calendar on the Active dashboard
### Confirm the paused state
After a pause date is selected, the status changes from Active to Paused and the selected date appears in the pause control.
Paused status with the selected pause date
### Clear the temporary pause date
Move the pointer over the X icon to display the Clear Date tooltip, then select the icon to remove the pause date. A date tooltip can also appear near the date-related control while it has focus.
Clear Date tooltip for the temporary pause control
### Confirm monitoring reactivation
After the pause date is cleared, the status returns to Active and the pause control returns to Select Date.
Active status after the pause date is cleared
### Turn off Anomaly Detection permanently
Enable Turn off anomaly detection permanently to stop the active monitoring job.
Permanent Anomaly Detection stop control
### Confirm the permanent stop
The Confirmation dialog reports that the job is currently running and requests confirmation to stop it. Select CONFIRM to continue or CANCEL to retain the active job.
Confirmation dialog for stopping a running job
### Review the stopped state
After confirmation, the status changes to Stopped and the permanent-stop switch remains enabled.
Stopped status after Anomaly Detection is turned off
### Resume a stopped job
Disable Turn off anomaly detection permanently. The Confirmation dialog reports that the job is currently stopped and requests confirmation to resume it. Select CONFIRM to restart monitoring.
Confirmation dialog for resuming a stopped job
### Review initialization and select the dashboard date range
The status changes to Initialize while monitoring restarts. Use Date range (7 days) to select the dashboard start date. Vault automatically sets the end date to the selected start date plus six days.
Initialize status and seven-day dashboard date-range calendar
---
# Agent Instructions
This documentation is published with GitBook. GitBook is the documentation platform designed so that both humans and AI agents can read, navigate, and reason over technical content effectively. Learn more at gitbook.com.
## Querying This Documentation
If you need additional information that is not directly available in this page, you can query the documentation by asking a question.
Perform an HTTP GET request on the following URL with the `ask` and `goal` query parameters:
```
GET https://knowledgebase.autorabit.com/product-guides/vault/vault-features/anomaly-detection.md?ask=&goal=
```
`ask` is the immediate question: it should be specific, self-contained, and written in natural language.
`goal` is what the user is ultimately trying to achieve, the reason they need the answer. Sharing it helps GitBook give you a better, more relevant answer. A goal is most helpful when it describes the outcome the user wants rather than restating the question. For example, with `ask=how do I create an API token`, a goal like `automate deployments from our CI pipeline` lets GitBook tailor the answer to that use case.
The response will contain a direct answer to the question and relevant excerpts and sources from the documentation.
Use this mechanism when the answer is not explicitly present in the current page, you need clarification or additional context, or you want to retrieve related documentation sections.