# Code Coverage Reports
The code coverage report provides information about the apex tests that are run, the covered classes, the assertions that have failed, and the percentage of the code covered by the test execution for an org.
* To view the code coverage report, it needs to generate first.
* Also, it's a good idea to delete the existing apex class data from your Salesforce org before performing the code coverage.
### Generating the code coverage report
1. Hover your mouse over the **Admin** module and select the option: **SF Org Mgmt.**
2. Select the **Salesforce Org** and click on **Generate Code Coverage Report.**
3. Next, fill in the details to run the apex test class for the selected Salesforce Org. Click **Update & Run**.
{% hint style="info" %}
**NOTE**: If the test level is a **run-specific test**, ARM will check only **newly added code** against the specified test.
{% endhint %}
### Viewing the code coverage report
1. Go to the **Reports** module from the ARM home page.
2. Click on the **Code Coverage Reports** tab.
3. Choose your **Salesforce Org** from the dropdown to view the detailed code coverage report.
Each code coverage report generated reflects the details listed below:
| Title | Description |
| ------------------------------- | ------------------------------------------------------------------------------------------------------------------------------ |
| Iteration | The revision number of the Salesforce Org for which the code coverage report is generated |
| Last Triggered By | Details for the author who triggered the most recent code coverage report |
| Run Type | Whether the report is generated, scheduled, or forced (on demand) |
| Test Level | Apex test levels, i.e., specific test or running apex class on all tests in an org |
| Status | Status of code coverage (failure or success) |
| Overall Code Coverage In Org | Percentage of code coverage in total |
| Methods Executed | The total number of methods executed |
| Total Failures | The total number of failures that occurred when executing the code coverage. |
| Total Execution Time (hh:mm:ss) | The overall amount of time (in hours, minutes, and seconds) it took to generate a code coverage report for your Salesforce Org |
#### Log Details
View the apex test results log information by clicking on the **Log** icon.
#### Apex Test Results
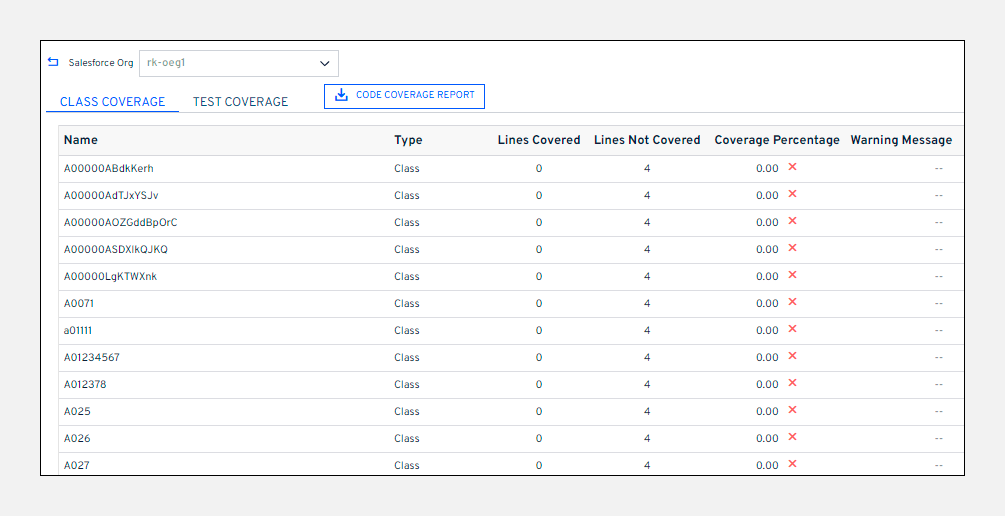
View the *apex class coverage* and the *apex test coverage* on the **Apex Test Results** screen. You can view the number of covered and uncovered lines for each test coverage. In addition, you can download both reports locally in **CSV** format as well.

#### Apex Test Summary
{% hint style="info" %}
* The **Apex Test Summary** tab was included in the **ARM 21.5** release. However, it will not be available to users who are still using prior versions.
* For newly generated code coverage reports, the apex test summary will be available; for old ones, you may see the following error: ***Code coverage summary file not found.***
{% endhint %}
After running tests, you can view code coverage information in the **Apex Test Summary** screen. This screen includes the following information:
* Total number of tests that ran
* Code coverage statistics (classes/methods enqueued, completed, and failed)
* Error information for each failed test
* Information for each test that succeeds
* The time it took to run the test
---
# Agent Instructions: Querying This Documentation
If you need additional information that is not directly available in this page, you can query the documentation dynamically by asking a question.
Perform an HTTP GET request on the current page URL with the `ask` query parameter:
```
GET https://knowledgebase.autorabit.com/product-guides/arm/arm-features/reports/code-coverage-reports.md?ask=
```
The question should be specific, self-contained, and written in natural language.
The response will contain a direct answer to the question and relevant excerpts and sources from the documentation.
Use this mechanism when the answer is not explicitly present in the current page, you need clarification or additional context, or you want to retrieve related documentation sections.